


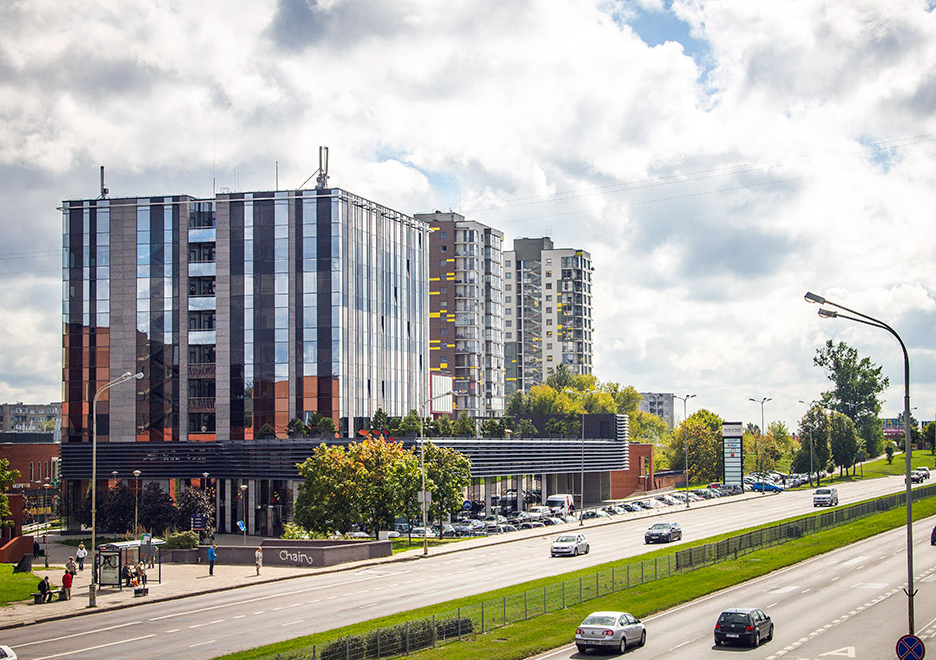
An Estonian investment company Eften Capital managed real estate fund Eften Real Estate Fund III bought an office property building Evolution, located in Ukmergės st., in Vilnius. Ober-Haus supervised the deal representing the seller – Evolution Office System, which sold its 13,300 sqm commercial purpose property for 9,02 million euros.
The ten-storey building was built in 2009 and consists of offices, commercial premises on the ground floor and a multi-storey 229 space car parking lot. The building has a leasable area reaching 6,200 sqm.
Currently 86% of the building is occupied by 15 different companies that are working there. The biggest tenant is communication company Telia. Other tenant companies include Eurovaistinė, Grifs AG, Compensa Life, Akzo Nobel Baltics, Linus medical, Dussmann Service. According to the estonian fund representatives – the building should generate a net annual profit of approx. 8% if fully leased.
 The Ober-Haus Lithuanian apartment price index (OHBI), which records changes in apartment prices in the five major Lithuanian cities (Vilnius, Kaunas, Klaipėda, Šiauliai and Panevėžys), increased by 0.2% in April 2018. The annual apartment price growth in the major cities of Lithuania was 2.9% (the annual apartment price growth in March 2018 was 2.8%).
In April 2018 the biggest apartment price increase was recorded in Šiauliai and Panevėžys, where prices increased respectively by 0.7% and 0.8% and the average price per square meter reaching EUR 624 (+5 EUR/sqm) and EUR 588 (+5 EUR/sqm). Meanwhile, in Kaunas and Klaipėda the same price growth was recorded and was 0.5% with the average price per square meter reaching EUR 1,042 (+5 EUR/sqm) and EUR 1,045 (+5 EUR/sqm) respectively. In Vilnius no price change was recorded and average apartment price remained the same as in March 2018 – EUR 1,469.
In the past 12 months, the prices of apartments grew in all major cities: 4.8% in Kaunas and Panevėžys, 3.8% in Šiauliai, 2.3% in Klaipėda and 2.2% in Vilnius.
“This year a further apartment price standstill has been recorded in the country’s capital. Since the beginning of 2018, the prices for apartments have largely remained at the same level in Vilnius. Meanwhile a further slight, but steady increase in the prices has been recorded in other major cities of the country.
Unlike the prices for apartments, the activity level of the apartment market in Vilnius continues to grow and has already exceeded the indicators at the beginning of the previous year. According to the State Enterprise Centre of Registers, 946 apartment purchase and sales transactions were concluded in April this year, 1% more than in March this year, making this the best monthly result this year so far. The activity indicators of the first four months of 2018 show a 1% increase in the number of transactions compared to the same period in 2017.
Similar trends can be observed in Klaipėda and Panevėžys, where, a 7% and 12% increase in the number of transactions for apartments respectively was recorded compared with March 2018. April has been the most active month in these cities so far this year too. At the same time, the results in April in Šiauliai and Kaunas compared to March this year were poorer – a 4% and 12% decrease in the number of transactions for apartments was recorded respectively.
Essentially, spring moods continue to dominate in the housing market maintaining the market activity at the levels of the beginning of 2016 and 2017 and a moderate price growth,” Raimondas Reginis, Ober-Haus Market Research Manager for the Baltic countries, said.
Lithuanian Apartment Price Index, April 2018
 The Ober-Haus Lithuanian apartment price index (OHBI), which records changes in apartment prices in the five major Lithuanian cities (Vilnius, Kaunas, Klaipėda, Šiauliai and Panevėžys), increased by 0.1% in March 2018. The annual apartment price growth in the major cities of Lithuania was 2.8% (the annual apartment price growth in February 2018 was 3.2%).
In March 2018 was recorded 0.1% price decrease in Klaipėda with average price per square meter dropping to EUR 1,040 (-1 EUR/sqm). Meanwhile, in Vilnius, Kaunas and Šiauliai apartment price increase was recorded, where prices increased respectively by 0.2%, 0.2% and 0.3% and the average price per square meter reaching EUR 1,469 (+2 EUR/sqm), EUR 1,037 (+2 EUR/sqm) and EUR 619 (+1 EUR/sqm). In Panevėžys no price changes were recorded and average apartment price remained the same as in February – EUR 583.
In the past 12 months, the prices of apartments grew in all major cities: 4.4% in Kaunas, 3.6% in Panevėžys, 3.1% in Šiauliai, 2.4% in Vilnius and 2.1% in Klaipėda.
‘Traditionally, the beginning of spring in Lithuania records increasing activity in the housing market. This March was no exception: according to data of the State Enterprise Centre of Registers, the number of housing transactions concluded in Lithuania in March was 25% higher than in February. In terms of the apartment segment, all the main cities of the country saw growth over the given period: the number of apartment transactions in Vilnius increased by 46% in March compared to February, in Panevėžys – by 32%, in Klaipėda – by 23%, in Šiauliai – by 23% and in Kaunas – by 8%. The most intense growth in activity was recorded in the capital city of Lithuania which was mainly determined by extremely poor indicators in February.
Despite the fluctuations in the activity of the housing market at the beginning of the year or slightly falling monthly prices from time to time in individual big cities of the country, in principle, the apartment market in Lithuania remain very active. Although selling prices of apartments in big cities have shown decreasing growth, there is still a moderate price growth in all cities’, Raimondas Reginis, Ober-Haus Research Manager for the Baltics, said.
Lithuanian Apartment Price Index, March 2018
The year 2017 in the Lithuanian housing market was one of the most productive and active in the history of Lithuania. The aggregate Lithuanian housing market activity and financial indicators exceeded the results achieved in 2016 and were only lower than the 2007 indicators. At the same time a faster growing contribution of the regions (other than Vilnius region) into the Lithuanian housing market was also recorded.
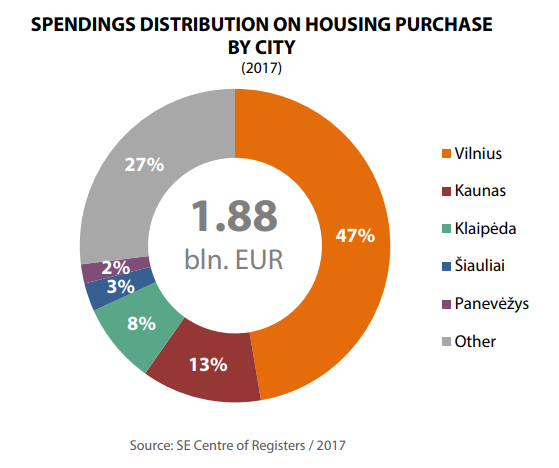 According to the State Enterprise Centre of Registers, in 2017 nearly EUR 1.88 billion or 7% more than in 2016 was spent for the acquisition of residential property (apartments and houses). However, trends differ between major cities. In Vilnius, nearly EUR 889 million was spent on the acquisition of housing in 2017 or 1% less than in 2016. In the meantime, in Kaunas the largest positive change was recorded among all major cities – with nearly EUR 235 million spent on the acquisition of housing or a massive 24% more than in 2016. An increase of 7% on housing expenditure was recorded in Klaipėda (nearly EUR 157 million), in Šiauliai – 6% (almost EUR 55 million) and in Panevėžys – 21% more than in 2016 (over EUR 37 million).
Similar trends can be observed in the investment per capita for the acquisition of residential property in the major cities of the country. In 2017, the residents of Vilnius spent the largest amount on the purchase of apartments and houses – EUR 1,626 per capita on average or 1% less than in 2016. The second highest level of housing expenditure per capita was recorded in Klaipėda – EUR 1,049 or 9% more than in 2016. Although Kaunas comes third according to per capita expenditure for the purchase of housing in 2017, the largest positive change was recorded here among the major cities – an average of EUR 809 per capita or a massive 27% increase compared to 2016. The average figure in Šiauliai was EUR 546 (8% more than in 2016) and in Panevėžys – EUR 415 (25% more than in 2016).
Despite a slight increase in mortgage rates in Lithuania, the overall favourable situation in the loan market further stimulated the Lithuanian housing market in 2017. According to the Bank of Lithuania, the average interest rate on new housing loans in 2017 was 2.01% (in 2016 – 1.95% and in 2015 – 1.88%). At the same time the mortgage lending volume and the total housing loan portfolio in Lithuania reached new heights. According to the Bank of Lithuania, in 2017 the remaining loan balance in Lithuania increased by 9.1% to EUR 7.0 billion reaching a historical peak. In 2017, new loans in the amount of EUR 1,178 million were issued in Lithuania and this is almost 12% more than in 2016.
According to the State Enterprise Centre of Registers, the same number of purchase and sale transactions for apartments were concluded in Lithuania in 2017 as in 2016 (33,179 in 2016 and 33,176 in 2017), and 7% more purchase and sale transactions for houses than in 2016 (9,845 in 2016 and 10,529 in 2017). Looking from the historic perspective, the year 2017 was one of the most active in Lithuania and only in 2005 and 2007 the number of residential property transactions was higher. However, trends differ between major cities. In Vilnius, Šiauliai and Klaipėda a decrease in the number of housing transactions (apartments and houses) was recorded compared to 2016: by 6% in Vilnius and Šiauliai and by 2% in Klaipėda. In the meantime, an increase of 5% was recorded in Panevėžys and 4% – in Kaunas. In terms of the relative scope of the transactions per 1,000 citizens, Klaipėda took over the lead from Vilnius in 2017 with the sale of 21.6 apartments/houses per 1,000 citizens, 20.3 – in Vilnius, 18.3 – in Kaunas, 18.0 – in Šiauliai, and 15.3 – in Panevėžys.
Positive economic development in the country encouraged further increase in the prices of the residential property in 2017, yet the relative changes in major cities were somewhat more modest than in 2016. Of all major cities, a faster increase than in 2016 was only recorded in Kaunas. According to data from Ober-Haus, apartment prices in Kaunas increased by an average of 4.8% in 2017 – the price for relatively old apartments increased by an average of 3.0% and for newly constructed apartments – by 8.8%. In Vilnius, Panevėžys, Šiauliai and Klaipėda an increase in the prices of apartments of 3.6%, 3.1%, 2.7% and 2.4% respectively was recorded. The fastest (4% on average) annual growth in the prices of private houses in 2017 was recorded in Vilnius and its suburbs. An increase by an average of 3% in the sale prices of houses was recorded in the regions of Klaipėda, Šiauliai and Panevėžys and an increase by an average of 1% was recorded in Kaunas and its suburbs.
Despite the rapid increase in the supply of apartments for renting in Vilnius over the past years and therefore forecasts regarding a decrease in rents, a symbolic 1% increase in rents was recorded in Vilnius in 2017. The rental market of the capital city remains active and the new supply was substantially absorbed at the same rent levels as in 2016. In the meantime, lower availability of apartments for renting in Kaunas and Klaipėda (especially newly constructed apartments) caused a slightly faster increase in rents in 2017. Rents in Kaunas increased by an average of 4% and in Klaipėda – by 7%. In 2017, the average rent of a 1-3 room apartment in Vilnius was 384 EUR/month, in Kaunas – 295 EUR/month, in Klaipėda – 291 EUR/month, in Šiauliai – 163 EUR/month and in Panevėžys – 137 EUR/month.
The year 2017 saw further growth in investment in construction of new residential buildings in Lithuania. According to Statistics Lithuania, construction works (new construction, reconstruction, repair, restoration, etc.) totalling almost EUR 456 million were performed in the residential property market in 2017 (almost 18% of all construction works performed in the country) or 4.5% less than in 2016 (prices of 2016). However, almost 7% growth in the volume of new construction works was recorded in Lithuania last year.
Experienced developers and higher-class apartment projects prevail
According to data from Ober-Haus, 4,144 apartments in apartment buildings were built in Vilnius in 2017 or 12% more than in 2016. A total of 48 different projects of apartment buildings or their stages were completed in the capital city in 2017. The number of new apartments was the largest since 2008 when 5,471 apartments were built in Vilnius. Projects completed in 2017 were very diverse (in terms of quantity, geography and quality), yet developers tended to invest in the construction of higher class and more expensive apartments. The share of such apartments (the price of the apartments without final fit-out is in excess of 2,000 EUR/sqm) increased from 13% to 18% in the overall annual supply in 2017. These are the projects which offer apartments in the most expensive areas of the city of Vilnius – the centre, the Old Town and other prestigious areas. The share of the medium class apartments (the price of the apartments without final fit-out is between 1,500 EUR/sqm and 1,900 EUR/sqm) in 2017 increased from 48% to 52%. In the meantime, the share of economy class apartments (the price of the apartments without final fit-out is up to 1,500 EUR/m2) decreased from 39% to 30%.
In 2017, experienced developers dominated in the new apartment construction market in Vilnius and the portion of the companies not known in the market (newcomers) decreased compared to 2016. In response to the favourable situation in the market, experienced developers increased their investment portfolio in the residential property market focusing on large-scale projects, while the newcomers developed small projects. Experienced developers, each of which has completed at least four different residential projects, constructed 66% of all apartments in the capital city (in 2016, this figure was 58%). Less experienced developers, each of which has completed 2–3 projects, constructed 24% of all apartments (the figure for 2016 was 21%). The share of apartments constructed by new companies, which do not have any housing development history (i.e. have implemented not more than one project or are only beginning their operations), decreased in 2017 from 21% to 10%. The year 2018 in the apartment market in Vilnius looks promising – construction of at least 4,500 new apartments is scheduled.
More active development of detached and semi-detached houses, which started in 2015–2016, is bearing fruit. In 2017, developers built around 490 new houses in Vilnius and its suburbs or 54% more than in 2016 and twice as many as in 2015. At the same time it is the highest annual supply indicator over the past 15 years (only in 2007, a similar number of houses was supplied to the market). Construction of even a larger number of detached and semi-detached houses is planned in Vilnius and its suburbs in 2018, which could reach up to 550 units. Sales of new houses inspire optimism of developers – at the end of 2017, 85% of the completed houses were sold and reserved.
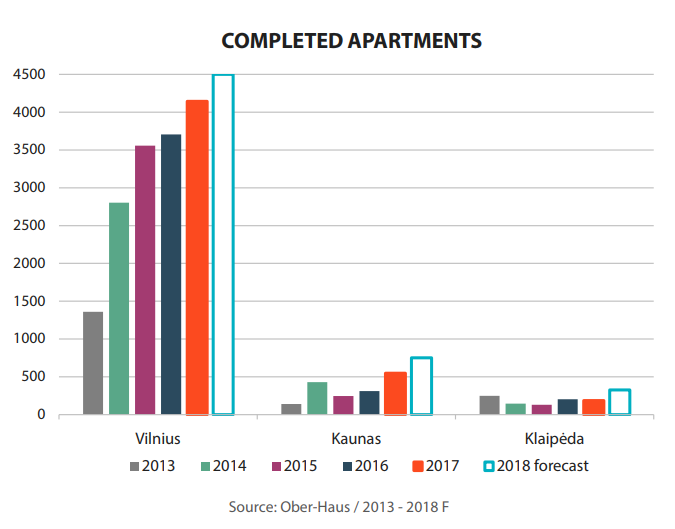 A rapid increase in supply of newly constructed apartments was recorded in Kaunas in 2017. According to data from Ober-Haus, a total of 547 apartments were built in Kaunas in 2017, which is a 76% increase compared to 2015. The year 2018 promises to be even more productive – construction of 700-800 new apartments in apartment buildings in Kaunas is planned. Six apartment building projects or project stages were implemented in Klaipėda in 2017, which offered 186 apartments (8% less compared to 2016). In the period between 2010 and 2017, on average 200 new apartments in apartment buildings were constructed in Klaipėda each year, but developers did not engage in any further active development projects. However, in 2018 more active development is planned, as a result of which 300–350 new apartments should be offered to the market.
Last year the number of unsold new apartments increased in Vilnius only
The overall decrease in the activity of the new apartment market in major cities in 2017 was due to lower sales volumes in the country’s capital. On the contrary, sales volumes in other cities of the country increased. According to data from Ober-Haus, a total of 4,957 new apartments were purchased or reserved directly from the builders in completed apartment buildings and apartment buildings in progress in Vilnius, Kaunas and Klaipėda in 2017. This was a decrease of almost 7% compared to 2016. In 2017, 3,851 new apartments were sold/reserved in Vilnius, a 12% decrease compared to 2016. This should not come as a surprise, because the sales indicators for new apartments achieved in Vilnius in 2016 were the highest in the past eight years and would be hard to replicate. In 2017, 723 new apartments (a 25% increase compared to 2016) were realised in Kaunas and 383 apartments (a 1% increase compared to 2016) in Klaipėda.
Large scale construction of new apartments in the country’s capital in 2017 determined an increase in the number of vacant apartments in completed apartment buildings while, on the contrary, the figures for Kaunas and Klaipėda decreased. By the end of 2017, the total number of unsold apartments in completed apartment buildings in the three cities was 1,888, which was an increase of 9% compared to 2016. By the end of 2017, 1,359 apartments were offered for sale in apartment buildings in Vilnius built in 2007–2017 (there were 1,013 vacant apartments by the end of 2016); this figure was 151 for Kaunas (239 vacant apartments by the end of 2016) and 378 for Klaipėda (485 vacant apartments by the end of 2016). Until there is any slowdown in the construction of new apartments in the country’s capital, the number of unsold apartments will remain stable or will increase slightly. The largest number of unsold apartments in newly completed apartment buildings was recorded at the end of 2015 and totalled over 1,400. High sales volumes reduced the figure to nearly 900 vacant apartments at the beginning of 2017. The situation in Kaunas and Klaipėda is the opposite – increasing demand for new housing and moderate construction volumes decreased the number of vacant apartments in the course of 2017.
People’s financial capacity for buying housing continues to grow
The ratio between the price of apartments and the level of wages in major cities of the country in 2017 continued to improve for the benefit of buyers. According to Statistics Lithuania, the average net wages in Vilnius, Kaunas, Klaipėda, Šiauliai and Panevėžys in 2017 increased by 5.6–9.6% on average as compared to 2016. According to data from Ober-Haus, the average price of apartments in these cities over the same period increased by 2.7–5.2% (average prices of 2017 compared to average prices of 2016). So statistically residents of these cities were able to buy more residential property in 2017.
According to data from Ober-Haus, a resident of Vilnius was able to purchase 6.2 sqm in a medium class apartment for the average net annual wage (5.9 sqm in 2016); a resident of Kaunas – 7.9 sqm (7.6 sqm in 2016), a resident of Klaipėda – 8.0 sqm (7.8 sqm in 2016), a resident of Šiauliai – 11.7 sqm (11.3 sqm in 2016) and a resident of Panevėžys – 13.3 sqm (12.7 sqm in 2016).

,Despite the improving statistical ratio between the price of apartments and the level of wages, each case of home purchase may be different. For example, some buyers due to their growing personal needs opt for a more expensive home instead of an affordable home which would be easier to pay for. It is only natural that when borrowing for a more expensive home, the financial burden will be higher, therefore these buyers may not often feel the improving statistical ratio between the price of apartments and the level of wages,’ Mr Reginis said.
Lithuania Residential Market Commentary Q4 2017
 The Baltic real estate market was resilient enough and managed to recover quickly after the recent global economic recession and has shown visible subsequent successful development. However, despite the overall similarity between the countries, Estonia, Latvia and Lithuania are at different stages of development both in terms of comparing all the countries and individual processes within each country. The capital cities of the Baltic countries remain the hot spots of the real estate map.
‘If over the past five years impressive changes have been recorded in Tallinn and Vilnius, which are currently at new all-time highs, essential changes in Riga are still underway. Therefore, these cities can offer a wide range of liquidity risks to investors, developers and businesses. The markets of some capitals are becoming tight, which encourages market players to channel investments to other regions: suburbs of the capital cities, resort towns or other larger cities, e.g. to the second largest city in Lithuania – Kaunas’, Raimondas Reginis, Ober-Haus Research Manager for the Baltics, said.
The year 2017 was indeed successful for the Baltic countries, because further economic growth contributed to development of the real estate market. Despite various challenges faced by all the Baltic countries, the overall investment climate remains positive.
‘This is particularly important to foreign investors, who see those positive changes and this is translated into real actions. Foreign direct investment development agencies whose task is to increase awareness of the countries globally and to attract new investment play an increasingly important role in the real estate market. According to the information available to Ober-Haus, in 2017 foreign investment promotion agency Invest Lithuania achieved the best result in the history of its operations and attracted 39 foreign direct investment (FDI) projects; these new projects will lead to the creation of over 5,000 new jobs in Lithuania. And it is important to note that, in addition to Vilnius, a substantial part of this FDI will go to other regions of the country, which will give an impetus to various real estate sectors,’ Mr. Reginis said.
In the meantime, investment in commercial property which generates stable income has remained high on the agenda. In 2017, the highest activity rate in the Baltic real estate market was recorded in Lithuania, where investment volumes in core commercial property reached €312 million and outpaced the previous record in 2008 (€310 million). Activity in the investment transactions market determined a further decrease in yields, which in individual cases is lower than 6%. This attests to the overall confidence of investors in the markets of the Baltic countries and in particular in prime property. For those seeking higher yields, the Baltic real estate market can offer a wide range of different options to guarantee 8% or even higher yields to investors.
Expanding services sector companies have become the main players in the modern offices market and encourage a further quantitative and qualitative leap in this sector. In order to meet high demand, in recent years developers have significantly increased investment in the development of modern offices. According to Ober-Haus, in 2016–2018, a total of 450,000 sqm office space will be offered in the markets of the Baltic countries. Vilnius will have the largest share (46%) with Tallinn close behind (38%), while Riga will have the smallest increase in supply.
Despite the modest supply indicators in Riga, positive trends can be seen in this largest city of the Baltic countries – every year developers are more courageous and propose more and larger new projects to the market. ‘If the economic and social conditions remain favorable, Riga will have the greatest growth potential. However, developers invest not only in quantitative parameters, but also increase their focus on quality projects, which is becoming increasingly important for today’s clients,‘ Mr. Reginis added.
More and more money are spending on housing in Baltics
Ever better indicators are also recorded each year in the residential property sector. According to Ober-Haus, in 2017, buyers spent almost €3.7 billion on apartment purchases in the Baltic countries, 10% more than in 2016 (growth was recorded across all three countries). Estonia and Lithuania each account for 41% of this sum and Latvia accounts for the remaining portion (18%).
In terms of investment per capita, Estonia remains the obvious leader. ‘This is not surprising because Estonia and its capital Tallinn feature the highest average prices for residential property and largest activity in the housing market. Lithuania and its capital Vilnius are in second place and Latvia and its capital Riga are left furthest behind. The recent global crisis hit Latvia, whose capital city was previously labelled as the most expensive city of the Baltic countries, most severely,’ Mr. Reginis said.
Despite different activity trends in the housing market in the Baltic capitals in 2017, the total number of transactions remains high. According to the information available to Ober-Haus, after a record year in 2016, the number of apartment transactions in Vilnius in 2017 fell by 6%, in Riga fell by 1%. In the meantime, annual growth of 7% was recorded in Tallinn and this was a new high.
The trend of rising apartment prices remains in all Baltic capitals. In 2017, an annual increase in the price of apartments from 4% to 12% was recorded in the capital cities: apartment prices in Vilnius increased by almost 4%, in Riga – 6%, in Tallinn – 12%. ‘The main factors of housing activity and increase in prices remain the same – increasing income of the population, positive expectations of households, attractive mortgage conditions and confidence in the real estate market. The housing affordability indicators over the past three years show that the situation remains stable in all Baltic capitals, i.e. housing prices are essentially moving at the same rate and in the same direction as the income of the population,’ Mr. Reginis said.
Baltics Real Estate Market Report 2018
 The Ober-Haus Lithuanian apartment price index (OHBI), which records changes in apartment prices in the five major Lithuanian cities (Vilnius, Kaunas, Klaipėda, Šiauliai and Panevėžys), increased by 0.1% in February 2018. The annual apartment price growth in the major cities of Lithuania was 3.2% (the annual apartment price growth in January 2018 was 3.4%).
In February 2018 was recorded 0.1% price decrease in Vilnius with average price per square meter reaching EUR 1,467 (- 2 EUR/sqm). Meanwhile, in Kaunas, Klaipėda, Šiauliai and Panevėžys apartment price increase was recorded where prices increased respectively by 0.2%, 0.3%, 0.4% and 0.5% and the average price per square meter reaching EUR 1,035 (+2 EUR/sqm), EUR 1,041 (+3 EUR/sqm), EUR 618 (+3 EUR/sqm) and EUR 583 (+3 EUR/sqm).
In the past 12 months, the prices of apartments grew in all major cities: 4.9% in Kaunas, 3.7% in Panevėžys, 3.5% in Šiauliai, 2.8% in Vilnius and 2.6% in Klaipėda.
‘For the first time in three years, the capital city of Lithuania recorded falling prices in some housing segments. The biggest negative price changes were recorded this February in the segment of newly constructed apartments in the residential areas of Vilnius. Prices in these areas shrank by 0.7%. Although the prices of newly built apartments in the central area of the city or in the Old Town increased by 1.4%, the prices in the segment of old construction apartments in residential areas of the city remained, in principle, unchanged; meanwhile, growth of 0.3% was recorded in the central part of the city.
The recent general fall in the prices of apartments in Vilnius was seen at the end of 2014. Then the changes in prices were determined by the prevailing tension and buyers’ fears about the then geopolitical situation – the Crimean crisis and war in the eastern Ukraine. Meanwhile, now, both political and economic situations are more stable, however, recently, the dramatically increased volumes of new housing construction and the bigger competition among the developers has determined the decisions of some developers to liven up sales by decreasing the prices of some apartments.
Other major cities of the country feel the rhythm of growth – starting with the launched construction and the faster price growth and finishing with a calm market featuring moderate price changes’, Saulius Vagonis, Head of Valuation & Analysis Department at Ober-Haus, said.
Lithuanian Apartment Price Index, February 2018

Written by Raimondas Reginis, Ober-Haus Research Manager for the Baltics
Contents:
- Intro
- From the First Steps 16 Years Ago to the Full Spectrum of Workplaces
- From Global Cities to Smaller Ones
- Vilnius vs Warsaw
- Picking Up a Centrally Located Coworking Space in Vilnius
- What Vilnius is Missing on Coworking Spaces?
- More on Coworking Stuff
- Epilogue
Intro
Do you hear the buzz? The global workplace revolution has started as the coworking movement has exploded recently. And everyone is talking about it. Especially those who are involved in the real estate industry. Independent workers, smaller companies or representatives of bigger businesses want more flexible and cost-effective working spaces, which can offer a social environment and a work community in advance. And if there is a demand – here comes the option.
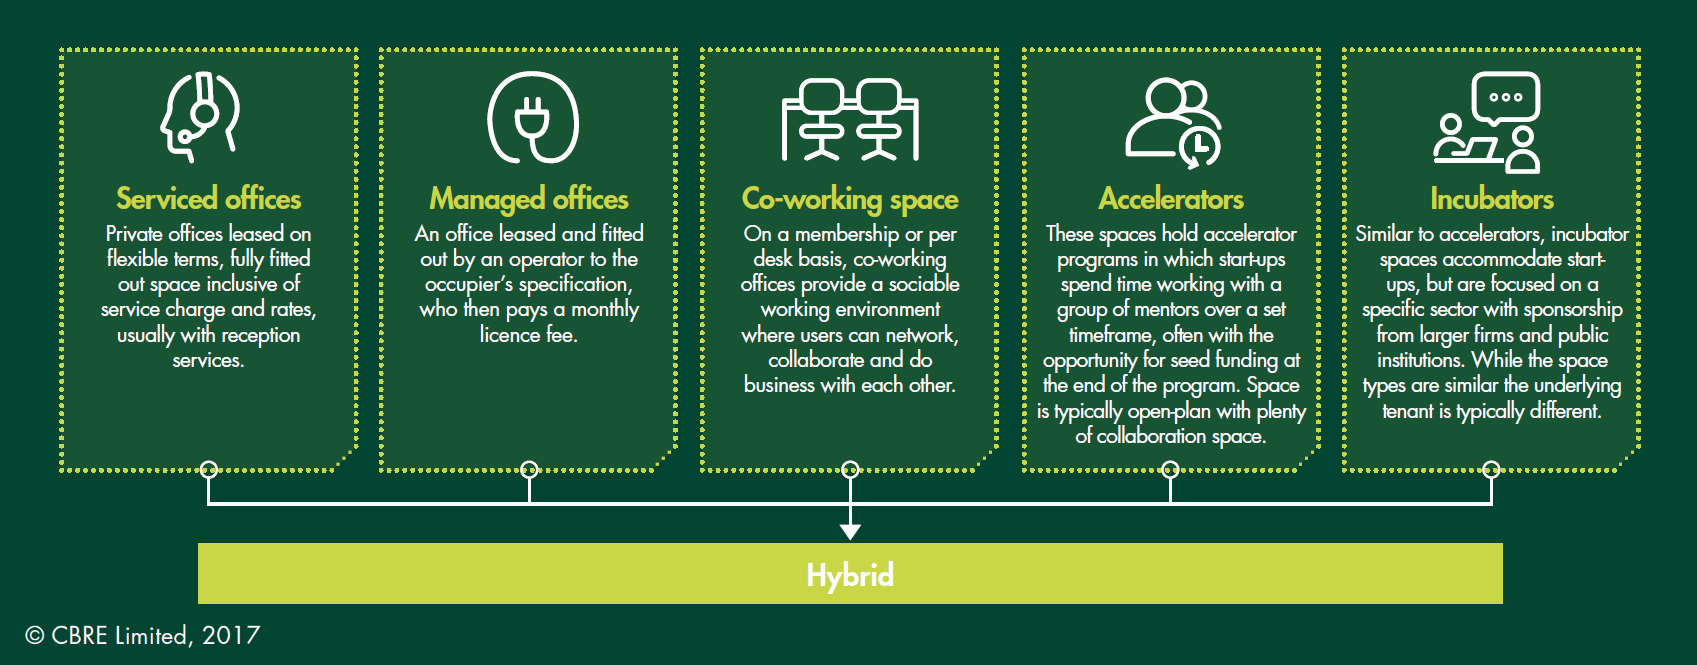
Over the past decade there has been noticeable growth in the flexible office sector globally with the real boom happening in the last 3-5 years. The economy, millennials and technology have all pushed landlords, serviced office operators and small investors toward the new business models. Traditional serviced offices, coworking spaces, incubators, accelerators and so on. From micro-coworking spaces to mega start-up campuses. From just the price of a cup of coffee for a hot desk for an hour to hundreds of euros for a private office per month. Different types with different names, still the core is the same – flexible workspace for everyone. And it’s not about square meters anymore. People are taking their suits off and moving from monotone inflexible offices to places providing interactions and a warm vibe. Globally.
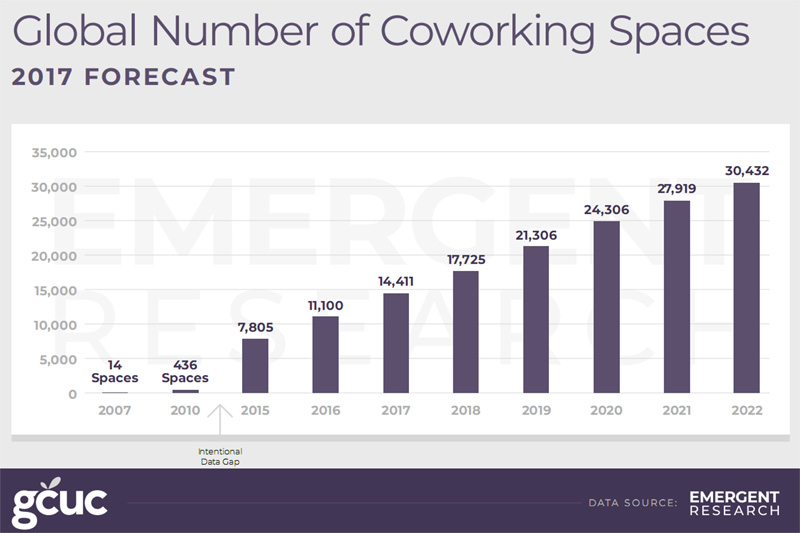
This coworking movement drives the flexible space market to new heights with tremendous growth recently and estimated further rapid expansion. The forecast report released by GCUC shows that the number of global coworking spaces will double in the next five years reaching over 30,000 spaces in 2022 (representing an average annual growth rate of 16%). At the same time the number of global coworking members will triple to reach 5.1 million.
From the First Steps 16 Years Ago to the Full Spectrum of Workplaces
Is Lithuania’s capital far behind this global trend? Let’s see. Do you know when the first flexible offices were introduced in Vilnius? It was 16 years ago – at the start of development of the modern office market. The first professionally managed serviced offices were introduced to the market in 2001. The developer of the newly built 8-storey office building (Business Center 2000) in the heart of the city offered fully fitted and serviced offices of 1,000 sqm and named it START OFFICE. This space is still operating and enjoying full occupancy. So, it was the start… and the end. The early bird remained alone for almost 10 years!
The period 1998-2002 was a tough one here in Lithuania. The Russian crisis, lack of businesses, low incomes and high rents for modern offices. And the continuous arrival of new office projects in the capital city led to decreasing rents and record high vacancy rates. Offering something more flexible to the market was something new, still one option was enough at that time. Later, the improving economy and demand triggered the fast expansion of the modern office market and everyone was just happy renting spaces with long-term leases.
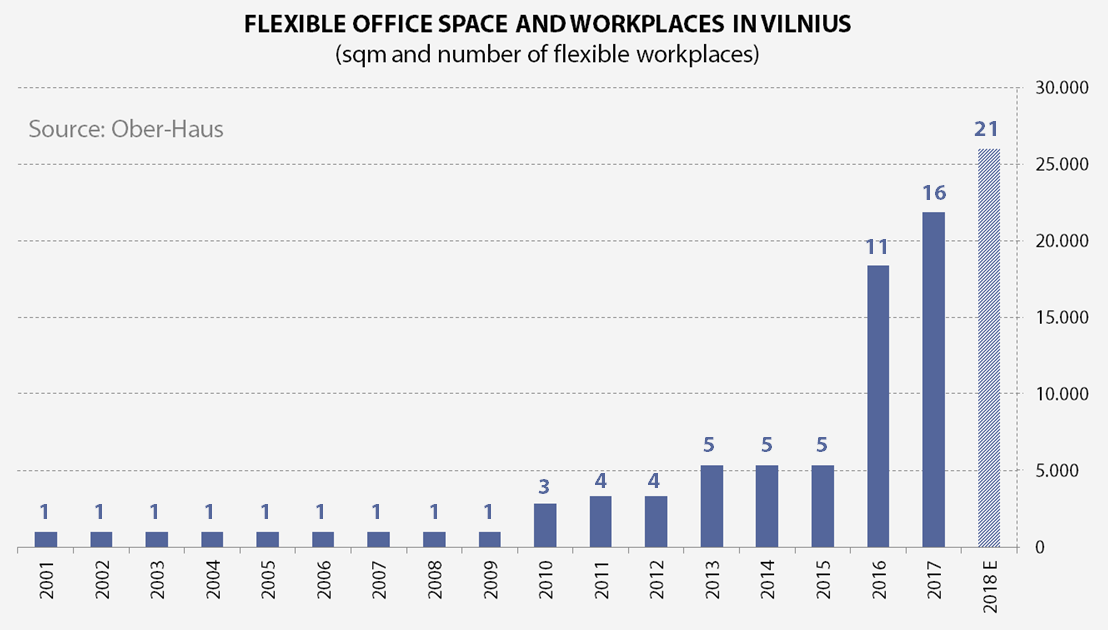
The flexible office market started again (actually the real start) in 2010. The world’s largest flexible workspace provider Regus entered Vilnius and there was a further traditional serviced office option from a local landlord. Also, in 2010-2013 the first coworking spaces started to appear in Vilnius. First steps, which have actually only become stronger and more visible since 2016. In just two years (2016-2017) total flexible office space in Vilnius quadrupled reaching almost 22,000 sqm at the end of 2017. Vilnius now has the full spectrum of flexible workplaces: from the smallest coworking place Coffice to the biggest ICT start-up hub in the region Vilnius Tech Park.
From Global Cities to Smaller Ones
If you read reports from different sources you will find different and misleading figures, data and other information about flexible spaces (like any other stuff in any industry). That’s normal, as different expertise, knowledge, subject coverage and approach will give you different databases, classifications, definitions, which will lead to different results. The biggest headache for analysts is comparing the data of different cities or regions, which is provided by different data providers. Each city, region or country has its own individuality with established standards and comparing mega cities in developed markets with small cities in frontier markets, makes things quite complicated. Still, we all do it every day. Just take this into account and always look at these indicators with some awareness and caution.
So, how does Vilnius compare to the global and emerging cities? London is the dominant leader in terms of flexible spaces and according to The Instant Group survey this city provides 1,136 flexible workplaces with New York in second place with 330 centres. We should take into account that these figures represent data from 2016 and some smaller, and not listed flexible options were not included in the statistics. And for sure, the numbers keep increasing every day. It’s 2018 already! But this is not the case for Vilnius city with a population of over 547,000, which at the end of 2017 offered just 16 flexible workplaces. It isn’t hard to pick them all and convert them to statistics. You know, small market advantage.
According to JLL, in London flexible workspace operators now occupy 3.5% of total office stock whilst across the Big 6 markets it is currently just 1.9%. Within London, the City market has the highest concentration of flexible office providers, representing 4.0% of all office stock. The latest Colliers report on flexible workspaces states that the biggest cities in Asia have shown tremendous growth of flexible spaces in the last year. The share of flexible spaces in CBD’s tops almost 18% in 2018 (Shanghai – 8.0%, Jakarta – 9.7% and Begaluru – 17.6%).
In general, flexible office space accounts for between 1% to 5% of total office stock varying from capital to capital (globally), still the more precise definitions are missing. Is it modern office stock dedicated to flexible office space or total flexible office space in the market divided by total modern office stock? The more common figure provided by real estate consulting firms is the share of flexible office space in total take-up of the leasing market.
Savills report on flexible workplaces in Poland gave me comparable data and suggestions for terms like, ‘Stock’ and ‘Non-stock’, which Ober-Haus will use from now on to give easy understandable and comparable data about flexible office space to others. Ober-Haus definitions of flexible workplaces are as follows:
Flexible offices – all types of spaces (serviced offices, coworking spaces, incubators, accelerators and others), which provide fully equipped and managed working spaces without requiring a long-term commitment for the space users.
Stock FS – flexible office space located in modern office or multi-functional buildings, which provides modern office space and which are considered as modern office stock.
Non-stock FS – flexible office space located in other facilities, which do not provide modern office space.
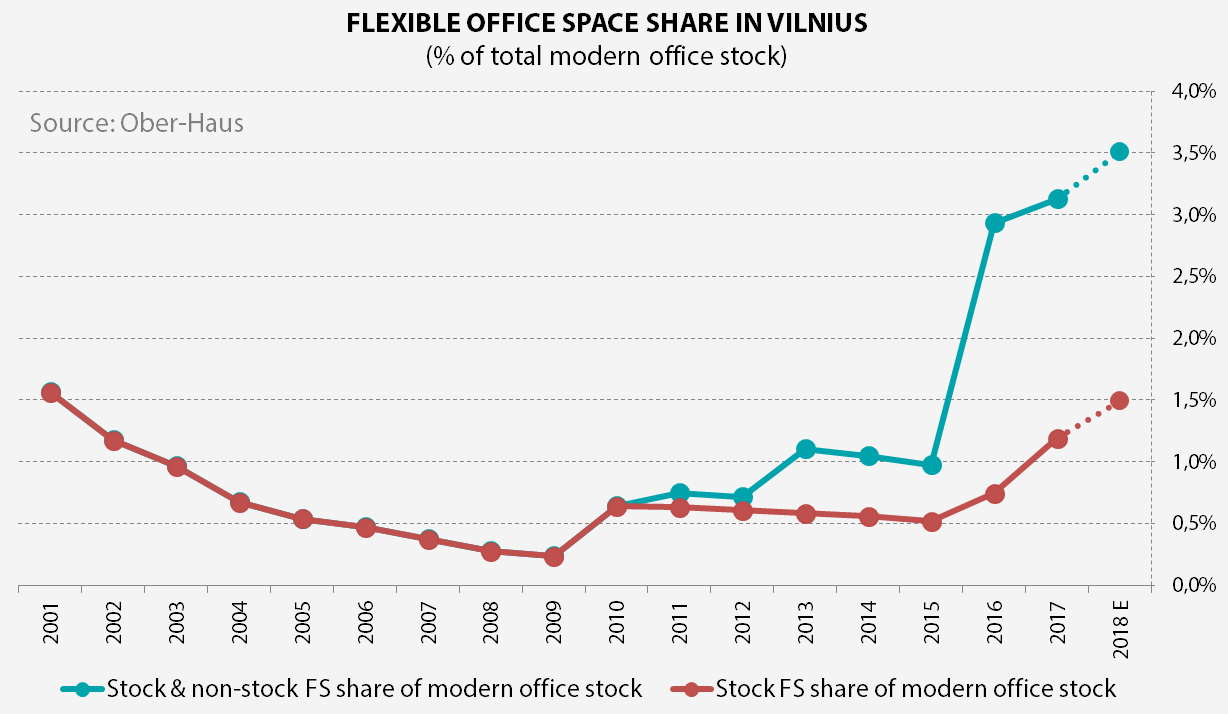
So, according to Ober-Haus data and definitions listed above, the share of flexible office space located in modern buildings (stock FS) in total modern office stock in Vilnius has doubled in the last few years and at the end of 2017 reached 1.2%. If we take the non-stock flexible space into account then this share jumps to 3.1% at the end of 2017. Or almost 22,000 sqm of flexible office space in 16 different locations within the city limits. During 2018 total flexible office space could increase to 26,000 sqm in 21 different locations and at the end of the year 1.5% of total modern stock will be dedicated to flexible office space.
Vilnius vs Warsaw
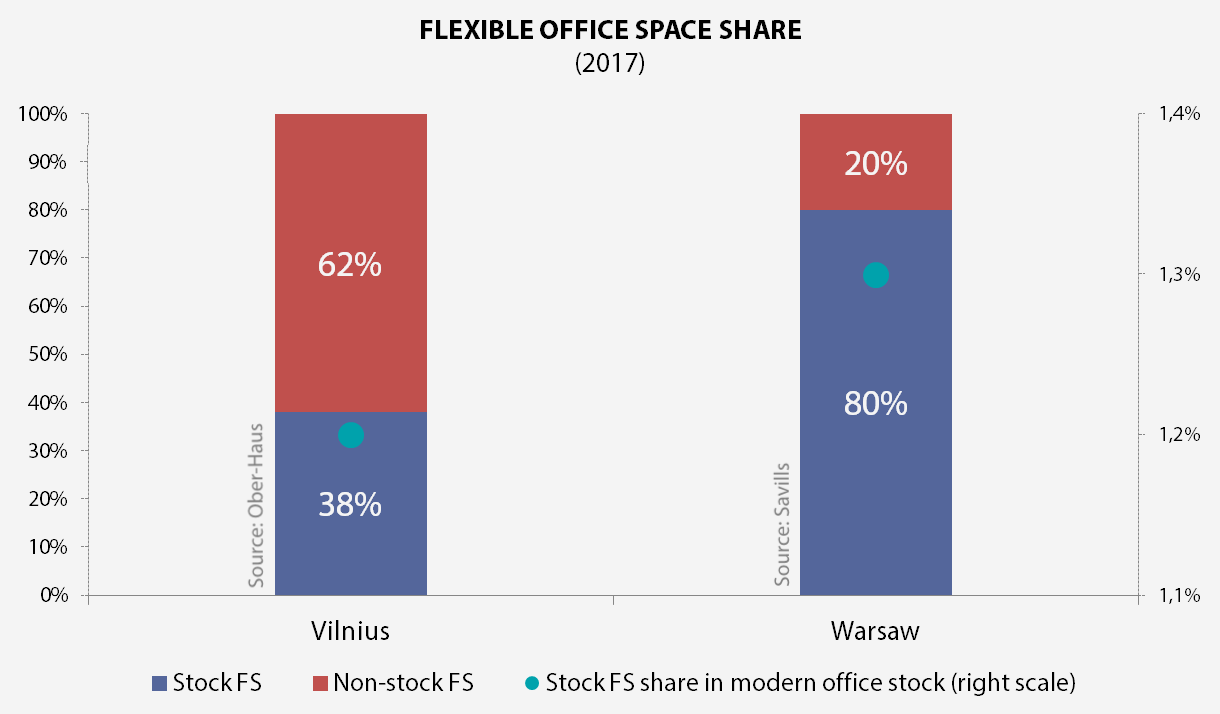
Let’s go back to our neighbouring country and its capital Warsaw with Savills’ figures. Almost four times more flexible office space compared to Vilnius doesn’t say much, right? Space per 1,000 population? Not a substantial difference: Warsaw – 48 sqm, Vilnius – 40 sqm. Maybe, different spaces per population? Yes, substantial difference. Counted per population Warsaw can offer almost twice as many flexible places as Vilnius: Warsaw – 5.4 places, Vilnius – 2.9 places per 100,000 pop.
Hey, but Vilnius has the biggest ICT startup hub in the region Vilnius Tech Park! Great, this campus concentrates over 40% of Vilnius total flexible office space in one place. Not so great at all. I mean it’s great for the ICT industry, but it doesn’t improve the availability in the market for other space users from different industries or professions. Warsaw wins with a score of 3:0. Vilnius, you’re not as flexible as I thought!
Categorizing flexible spaces by different types makes less and less sense as these spaces are evolving and transforming very fast. You always want to keep everything “under analytical control” and try to classify the subject of analysis by putting it on the right shelf. Not this time. The current flexible space sector is literally “flexible”. While we have had traditional serviced offices since the early ‘80s, in the last decade other types of spaces have changed a lot and expanded dramatically. Coworking spaces, incubators, accelerators and serviced offices are becoming hybrid by connecting with each other and offering different formats for a greater range of occupiers. Jaroslaw Pilch from Savills also pointed out the evolution of flexible spaces:

For example, the global serviced office giant Regus is increasingly dedicating more and more of its occupied space to coworking and offers hybrid options. The coworking behemoth WeWork went even further by dipping its feet into residential (WeLive), fitness business (WeWork Wellness) and even education (WeGrow). What’s next? Putting all this together and creating huge community type schemes with residences, shared offices, gyms, kindergartens, schools, cafes, shops, cinemas? Cool, but I’m too old for such things…
Picking Up a Centrally Located Coworking Space in Vilnius
Let’s say you are some kind of entrepreneur or freelancer and need an affordable cosy coworking place in the centre of Vilnius. So, what do we have here? At the end of 2017 Vilnius had 16 different flexible workplaces, but now at the start of 2018 you can choose from almost 19 options (Blockchain Centre Vilnius and Monday Office were opened at the start of 2018 and AltSpace is opening in a month). 19 options, let’s go!
Serviced offices with suited snobs – NO. Coworking spaces outside the city centre – OUT.
6 options left out of 19:
Monday Office (Upes St. 23) – Located in the newly opened office building Green Hall 2, which is close to the city centre (a 15-minute walk to Gedimino Ave.). Provides luxury type private offices and coworking space. From 27 Eur/day for a hot desk in an open plan office. Too extravagant for a regular user.
Blockchain Centre Vilnius (Upes St. 23) – Located in the same building as Monday Office, this place is the coolest in the entire galaxy! A state-of-the-art coworking and shared office space for blockchain start-ups. Can you imagine the place, which is represented by all the recent trendiest movements? COWORKING+BLOCKCHAIN+STARTUP! I already imagine hordes or crypto fans squeezing through the door. Antanas Guoga definitely knows what he’s doing. Still, if you’re not blockchain orientated, you won’t get the approval from the Board of this centre. Even offering them 200 Eur per month.
Rise Vilnius (Gyneju St. 14) – A purpose-built workspace for the FinTech community established by Barclays. Coworking + FinTech also sounds very trendy. This accelerator is in a good location (a 4-5-minute walk to Gedimino Ave.), has various spaces and provides mentoring for its users. Affordable (up to 120 Eur/month per place), but very much oriented to the FinTech industry. I guess you won’t get membership here if you’re not working on an innovative startup.
Fridge (Paneriu St. 39) – Affordable place for 129 Eur/month per membership and suitable for all types of professionals. Why is this place so affordable? Well, 1) it is located in the southern part of Naujamiestis district (a 2.5 km or 35-minute walk to Gedimino Ave.) 2) It’s in an old administrative building with simple fit-out/design space (-es). Simple and quite far from the heart of the city. Still, the community is awesome. Just look on their Facebook page. The introduction of new members, events, entertainments and a warm vibe all over the place. I love this place just by looking at their happy faces. This workplace represents the essence of coworking spaces.
NVO Avilys (Tauro St. 12) – A non-governmental organization (NGO) and social innovators’ space. Very good location, just a few minutes from Gedimino Ave. Located in a historic building and offers spaces with a very simple fit-out/design. Their previously occupied space in GO9 shopping centre was awesome (prime location with cosy fit-out/design). Despite the move to the new location, this community still looks very friendly and sociable. Not sure what the requirements for new members are.
Coffice (Sodu St. 3A) – One of the smallest coworking places in Vilnius. One-room retro style space located next to the bus/train station (20-minute walk to Gedimino Ave.). The name of this place (coffee+office) and business model says everything. Space per cup of coffee. When this place was opened in 2016, you could stay here for an hour just by buying a coffee from them or paying 8 euros for the day (+unlimited coffee included). At the moment, this space is fully occupied by longer-term users with a price of 80 Eur + VAT per month.
What Vilnius is Missing on Coworking Spaces?
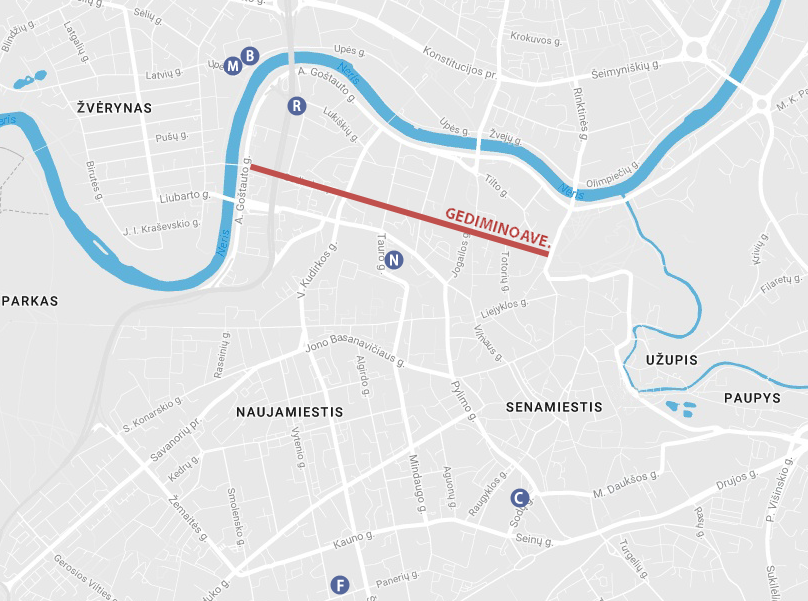
Looking at all these options one thing comes to mind. All these spaces are very different and there does not seem to be a middle ground. They are either industry specific, too luxurious and expensive, too simple or increasingly distant from the city centre. Let’s say you’re a professional who works in PR, marketing, advertising, sales, writing or some other profession and need an inspiring, affordable and cosy place in Vilnius (especially if you are a foreigner). What could be better than Gedimino Avenue or it’s adjacent streets? If you’re on this main street of Vilnius or close to it, then you are definitely in the heart of the city. Historical buildings, cafes, bars, shops with people walking around. Ideas and inspiration start to flow immediately.
One of the most expensive retail streets with its surroundings and an affordable place to work?! Sounds hardly possible, right? If you’re planning to open a coworking space in the best location, in a nice looking or new building with big windows facing the main street, then you are unlikely to offer space in the mid-price range. International Workplace Group (IWG) owned and operated brand Spaces will open a high-quality flexible workspace in a multi-functional project Live Square on Gedimino Avenue sometime in 2019. Prime location, new project and higher class space provider. Don’t expect this flexible space to be mid-priced.

How to solve this price/quality “problem”? Just look around or check the property listings. You will definitely find great options for setting up a new coworking space in the heart of the city. Basement premises or premises on top floors, which are not attractive for typical commercial activity could be great for coworking spaces. Just walk along Gedimino Avenue to a less business desirable zone and you’ll find premises on the ground/first floor and even with spacious windows facing the main street. And for much lower rental or selling prices compared to the most expensive zone of Gedimino Avenue. And who said that your space should be on the main street of Vilnius?? Turn left or right and you’ll find even more options at an affordable price.
In November 2017 one of my friends together with his partners opened a craft beer bar Local Pub on J. Jasinskio Street, in just 150 meters from Gedimino Avenue. The bar is located in a very “tired” two-storey brick building, still the bar concept, friendly staff and cosy fit-out/design makes this place really great. Average quality properties in less desirable locations could give you an advantage, as you do not overpay for the property. Of course, you need the right concept for people begin to flow into the house. So, why couldn’t a coworking space be in such a place? At the moment, there are even premises available in the same building as Local Pub.
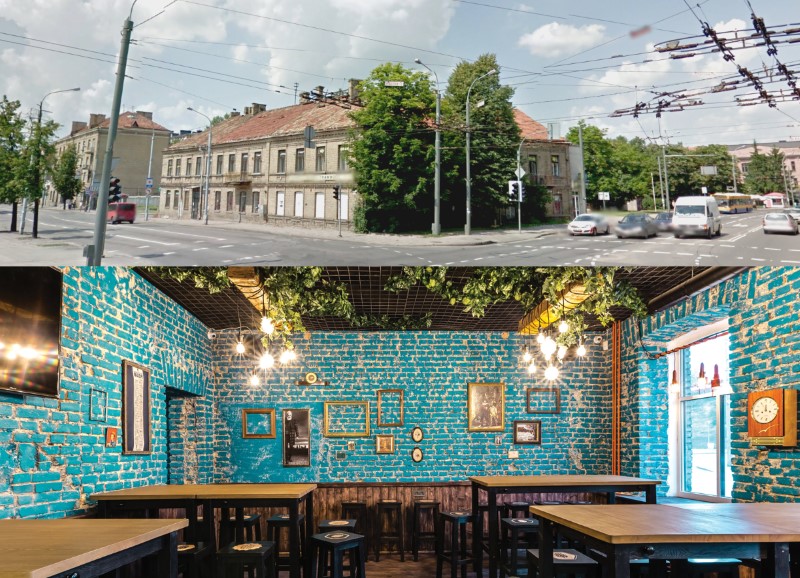
Be creative. Your bar, pub or club is full of clients on weekends and empty on work days? Convert your empty bar into coworking space by letting in the operator. Or do it yourself. Vidmantas, maybe this idea is even better than Local Pub workday lunches?
Just don’t forget about the essence of coworking. Cat Johnson got right to the point when she said: „After all, coworking without community is just working“. If you’re don’t have a collection of engaged people who care about the space and each other and a co-manager, then you are definitely not in this movement. A strong community can‘t exist without a leader(s). Community Manager. This role is very important as the community manager helps the community to be effective by picking up and introducing the new members, organizing networking events and providing all other technical and mentoring support that the community needs. You know, to keep a vibrant and balanced atmosphere in the house and keep it financially secure. And of course, spreading the word about the brand, community or available spaces on social media channels.
More on Coworking Stuff
Have you noticed that the coworking concept has already moved to office buildings? Companies trying to fill their occupied spaces with vibe and attract young workers (now companies honour them by calling them ‘Talents’). Ok, talents. Less formal outfits, no dedicated desks, open spaces, fully fitted kitchens, coffee machines, lounge zones, gym and gaming rooms painted in energetic colours and so on.
People involved in this movement even dispute how this magic word should be written. Coworking, co working, co-working or maybe co+working? Always ask the Inventor(s). As Brad Neuberg said – coworking. Or was it Bernard DeKoven? Still, we should also give some credit to the great artists from the late middle ages and their Renaissance workshops (read the great article by Piero Formica).
If you feel that your space is as cool as it can be, then take part in the Coworky Awards (check the nomination categories in which you can compete).
Epilogue
Vilnius, you are flexible. You are a great city full of potential spaces, creative and innovative people, cosiness and much more. And you’re becoming more flexible every day. With the rest of the world.

Discuss here: www.linkedin.com/flexible-vilnius-beginning-emptiness-start
Contacts:
Raimondas Reginis
Ober-Haus Research Manager for the Baltics
+370 699 73 377
raimondas.reginis@ober-haus.lt
 The Ober-Haus Lithuanian apartment price index (OHBI), which records changes in apartment prices in the five major Lithuanian cities (Vilnius, Kaunas, Klaipėda, Šiauliai and Panevėžys), increased by 0.1% in January 2018 (remained unchanged in December 2017). The annual apartment price growth in the major cities of Lithuania was 3.4% (the annual apartment price growth in December 2017 was 3.6%).
In January 2018 apartment price increase was recorded in Panevėžys and Šiauliai, where prices increased respectively by 0.7% and 0.6% and the average price per square meter reaching EUR 580 (+4 EUR/sqm) and EUR 615 (+3 EUR/sqm). Meanwhile, in Vilnius, Kaunas, Klaipėda the same growth was recorded and was 0.1% with the average price per square meter reaching EUR 1,469 (+1 EUR/sqm), EUR 1,033 (+2 EUR/sqm) and EUR 1,038 (+1 EUR/sqm) respectively.
In the past 12 months, the prices of apartments grew in all major cities: 4.7% in Kaunas, 3.7% in Panevėžys, 3.5% in Šiauliai, 3.2% in Vilnius and 2.5% in Klaipėda.
‘Indicators of the housing market of the past years in individual major cities in Lithuania show a slowdown in the rate of increase of apartment prices in some cities, while the rate remains stable or, on the contrary, faster increase has been recorded in other cities.
The country’s capital city has seen the biggest change and the price increase curve sloped down most rapidly. In the past three years, the annual rise of apartment prices in Vilnius peaked in January 2017 to 7.1%. Since that time, almost every month a decline in the annual rise has been recorded in Vilnius totalling 3.9% in 12 months to current 3.2%. This is not surprising, because sufficiently rapid increase in apartment prices has been recorded in Vilnius in the past five years, so the existing price level and other factors prevent further rapid rise.
In the meantime, the situation is the opposite in Kaunas, where over the past few years price increase has been recorded. If at the end of 2015/beginning of 2016 the annual rise of apartment prices in Kaunas remained below 1%, at the end of 2017/beginning of 2018 it exceeded 4.5%. The situation in Klaipėda, Šiauliai and Panevėžys can be described as stable – compared to Vilnius or Kaunas the rate of increase in prices has seen little change over the past few years and the direction of price development is unclear’, Raimondas Reginis, Senior Research Analyst at Ober-Haus, said.
Lithuanian Apartment Price Index, January 2018
 Services provided by the real estate agency Ober-Haus have been acknowledged by the international capital and financial market magazine Euromoney. In awards that were organised by Euromoney for the 13th time, Ober-Haus won two awards and was recognised as the Best Agency/Letting Advisor & Consultant and the Best Valuation Advisor & Consultant in Lithuania 2017.
“Synergy between the Commercial, Residential Departments and the Valuation and Analysis Departments ensures the high quality of services provided by us and the provision of a solution that is best for the client. All real estate services and the interaction between them will remain our priority in the future,” Remigijus Pleteras, General manager at Ober-Haus Lithuania, said.
“Reasonable growth in the number of experts without abandoning the quality of the services provided, a modern leadership and the involvement of the whole team determine the smooth work of the company in the services field. We appreciate the acknowledgement of Euromoney and market participants. Ober-Haus will continue to take the line that not quantity but focus on the client and the quality of services determine success in the real estate services market,” Mr. Pleteras added.
Euromoney magazine’s Real Estate Survey canvassed the opinions of real estate advisers, developers, investment managers, corporate end-users and banks. The survey was filled in at country level by senior executives. Respondents were asked to nominate the companies which they thought were the best in their market over the past 12 months.
Ober-Haus is the largest real estate service provider in Lithuania and the Baltic region and belongs to Realia Group, one of Finland’s largest real estate funds. Ober-Haus is a highly experienced provider of the most complete property services including residential and commercial real estate services, property and business valuation services, market research and property management.
 The Ober-Haus Lithuanian apartment price index (OHBI), which records changes in apartment prices in the five major Lithuanian cities (Vilnius, Kaunas, Klaipėda, Šiauliai and Panevėžys), remained unchanged in December 2017 (0.2% increase was recorded in November 2017). The annual apartment price growth in the major cities of Lithuania was 3.6% (the annual apartment price growth in November 2017 was 4.0%).
Despite unchanged price index for all major Lithuanian cities, there were recorded different price changes in different cities. In December 2017 apartment price increase was recorded in Kaunas, Šiauliai and Panevėžys, where prices increased respectively by 0.2%, 0.3% and 0.5% and the average price per square meter reaching EUR 1,031 (+2 EUR/sqm), EUR 612 (+2 EUR/sqm) and EUR 576 (+3 EUR/sqm). In Vilnius apartment prices remained stable and were the same as in November 2017 – EUR 1,468. Meanwhile in Klaipėda was recorded 0.2% price decrease with average price per square meter reaching EUR 1,037 (-2 EUR/sqm).
In the past 12 months, the prices of apartments grew in all major cities: 4.8% in Kaunas, 3.6% in Vilnius, 3.1% in Panevėžys, 2.7% in Šiauliai and 2.4% in Klaipėda.
‘Looking at general and individual results it can be stated that 2017 saw moderate growth in housing prices. After the 5.5 % growth in apartment prices in 2016, general growth in apartment prices in 2017 in the main cities of the country slumped to 3.6%.
Nevertheless, the assessment of individual cities’ results shows that trends are already changing. While Vilnius was the leader in house prices between 2010 and 2016, in 2017, the greatest price growth was recorded in Kaunas. In 2016, apartment prices in Kaunas grew by 4.3%, and over 2017, this figure climbed to 4.8% and resulted in the biggest relative change in housing prices among all cities of Lithuania. The days of increasing house prices in Vilnius are finished and we are now seeing rapid increase in the regional area of Lithuania which is undergoing considerable economic growth, lower price levels and also better housing affordability indices compared to Vilnius.
On the other hand, it should be remembered that the faster growth in apartment prices in Kaunas, which was recorded last year, is only a relative dimension. Looking at how much apartment prices in Vilnius and Kaunas grew annually in terms of euros per square meter instead of percentage, in 2017, Vilnius showed an increase of EUR 51 per square meter, meanwhile, in Kaunas this figure was EUR 47’, Saulius Vagonis, Head of Valuation & Analysis Department at Ober-Haus, said.